What's The Fundamentals Analysis

How, Why, When, What, Who, Invest

Fundamental Analysis and Technical Analysis

Introduction
Key Assumptions Of Technical Analysis
- High Liquidity
- No Artificial Price Changes
- No Extreme News
Fundamentals Of Technical Analysis
- Market Prices Reflect All The Information About A Stock
- Patterns Tend To Repeat Themselves
- Stock Prices Follow Trends
Importance Of Technical Analysis
- Mathematical Approach
- Signs Of Upcoming Danger
- Identification Of Short-Term Trends
Steps Of Technical Evaluation
- Chart Analysis
- Top-Down Technical Analysis
Strengths Of Technical Analysis
- Focus On Price
- Supply, Demand, And Price Action
- Support/Resistance
- Pictorial Price History
- Assist With Entry Point
Fundamental Vs. Technical Analysis
Important Points On Technical Analysis

Technical analysis is ultimately an analysis of supply and demand in the market to track the direction of price trend. In simple words, technical analysis is an effort to identify the market sentiment behind price trends. You need to know the benefits and limitations of technical analysis to convert it into a new set of tools or skills to trade or invest better in a long run.
Disregard of how complicated the technical analysis sound, they are reasonably easy to conduct if described right. So, in this article, we are going to describe the importance of technical analysis and learn technical analysis of stocks using these basics. Hence, let’s start from the beginning.
Technical analysis can be applied to stocks, indices, commodities, futures or any trad-able instrument where the supply and demand have the influence over price. Price data or market action denotes any combination of the open, high, low, close, volume, or open interest for a given security over a specific time-frame.
Technical analysis can be applied to all securities where the supply and demand have the influence over price. But this also means it will not work well when the factors other than supply and demand can influence the price of the security. So, to analyse the security successfully, technical analysis has three key assumptions:
- High Liquidity – Liquidity is basically volume. So, highly-traded stocks can be traded conveniently, with very low fluctuation in price of the stock. On the other hand, thinly-traded stocks do not have many frequent buyers or sellers, which makes it tough to trade. Moreover, low liquidity stocks are often very low priced, which also can be easily manipulated by individual investors. These external factors influencing thinly-traded stocks make them unfitting for technical analysis.
- No Artificial Price Changes – The most common influencer for artificial price changes are splits, dividends and distributions. An artificial price changes can intensely affect the price chart even when there is no difference in the value of the investment which make technical analysis difficult to apply. This kind of external factors that influence price can be tracked by altering the historical data prior to the price change.
- No Extreme News – Technical analysis cannot forecast extreme events, including business events such as a company’s CEO dying suddenly, and political events such as a terrorist act. The technicians have to wait patiently until the chart settles down, when the external factors like extreme news are manipulating the price. The charts will start to reflect the “new normal” due to such news.
So, in order to apply technical analysis, it is important to cross check if a security meets these three assumptions. This does not mean that analysis of any stock whose price is influenced by one of these external factors is hopeless, although it will affect the accuracy of that analysis.
If you want to use technical analysis for forecasting stock prices, then we need to assume that there is some relationship between historical chart patterns and future stock prices. This is the only to use historical data to forecast future prices effectively. There are three fundamental assumptions in the technical analysis of stocks.
- MARKET PRICES REFLECT ALL THE INFORMATION ABOUT A STOCK:
The fundamental analysis attach itself with financial and other information about a stock. But technical analysis of stocks, however completely detached from fundamental analysis, works on a similar principle.
When any technical analyst believe that all investors are aware of everything there is to know about a stock. They essentially use this information while making buy/sell decisions.
This information then gets reflected in the stock’s price and finally in the stock chart. This is the reason they only study chart patterns to evaluate market trends, ignoring all the fundamental factors.
- PATTERNS TEND TO REPEAT THEMSELVES:
The last assumption that validates a technical analysis is that trends are repetitive. Let’s suppose that a stock chart moves in an assumed pattern- A-B-C. So, each time we reach ‘C’, we will again start from ‘A’, and then go to ‘B’ and ultimately ‘C’. This pattern will repeat itself without fail.
Hence, to predict future stock prices based on technical analysis, you really need to make this assumption. Otherwise, there is no way to predict the price movement by simply looking at a chart.
- STOCK PRICES FOLLOW TRENDS:
Technical analysis of stocks is built on the foundation that each stock chart has its own unique trend. Prices move only within this trend. So, every move in the stock price will indicate the next move.
In other words, in stock charts, you evaluate the trend from past experiences. Logically, the movement in either direction may be larger or smaller than before, just like ripples. If you throw a larger or a smaller stone in the water, then the ripples too will be larger or smaller respectively. Though, the pattern of these ripples will not change intensely.
Technical analysis is widely used worldwide. The reasons for it growing popularity and its importance to the analysis of financial markets are as follow:
- MATHEMATICAL APPROACH:
Technical analysts calculate the probability while picking stocks. This enable them to foresee the consequence of an action saving all the effort to evaluate it in excessive detail.
So, technical analysis shows the price movements so that you don’t have to bother about the details that can cause the price movements. It is much faster and less bothersome than fundamental analysis.
- SIGNS OF UPCOMING DANGER:
If a major fall in stock prices is about to happen then nobody can see it coming. Even fundamental analysis tools fails to predict it. But, by using historical chart patterns and other technical tools, technical analysis can predict the fall. Now logically, it cannot tell you the reason for the fall, still it can warn you about its arrival. Yet, you can prepare yourself for it consequently.
- IDENTIFICATION OF SHORT-TERM TRENDS:
Fundamental analysis is suitable for those investors who want to invest for a long term of more than a year or so. Since any profitable business model takes time to be successful which affects the stock profitability. So, patient is the key for investor to earn in such kind of investment.
But that’s not the case with technical analysis as it cannot predict long term movements. Therefore, technical analysis is more applicable if you want to make a quick money in short term of three to six months, or even days.
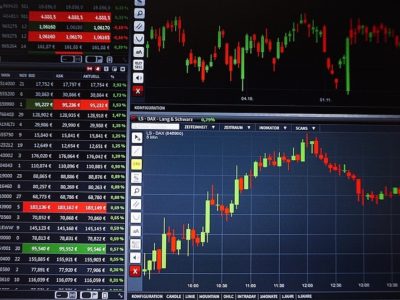
- Chart Analysis: Chart analysis is a graphical representations of the stock price movement over time where price is usually on the Y-axis and time is on the X-axis. For example: A chart shows a stock’s or commodity price movement in a graph of over one-year period where each point represents an individual day’s closing price. If the time period is of just one hour then each point represents one second. The most typical tools that are used as technical indicators for technical analysis are Price and Volume charts. A volume chart represents the number of shares of a company that were bought and sold in the market during a day. The traditional line or bar charts serves the purpose of technical analysis well, or you may also use a candlestick chart. A candlestick chart is in the form of a series of consecutive candles that is typically applicable for technical analysis. It. Charts are used together with trendlines to predict the price movements where trendlines indicate the direction of movement of a stock over a period of time.
- Top-Down Technical Analysis: A top-down technical analysis refers to breaking down of a system to gain understanding into its compositional sub-systems in a reverse engineering fashion. Top down approach starts with the big picture. For each segment (market, sector, and stock), an investor would analyse long-term and short-term charts to find those that meet definite standards. If the broader market were considered to be in bullish mode, analysis would proceed to a selection of sector charts. Those sectors that show the most promising output would be picked for individual stock analysis. After narrowing down the sector list to 3-4 industry groups, individual stock selection can begin. With a selection of 10-20 stock charts from each industry, a list of 3-4 most promising stocks can be made in each group. So, at last stocks could even be broken down further to find the 3-4 of the strongest of the strong to be selected.
- Focus on Price:
The price movements should be considered to predict the future price. The market is supposed as a leading indicator and usually leads the economy by 6 to 9 months. So, it makes sense to look directly at the price movements to keep pace with the market. Even if the market is prone to sudden fluctuations, it usually gives an indications before noteworthy moves. A technician will mention to periods of accumulation as indication of an impending advance and periods of distribution as indication of an impending decline.
- Supply, Demand, and Price Action:
While analyzing the price action of a security, many technicians use the open, high, low and close. There is information to be collected from each bit of data which would not make sense, if put up separately. However, taken together, the open, high, low and close reflect factors of supply and demand.
- Support/Resistance:
Simple chart analysis is very helpful to identify support and resistance levels. These levels are generally marked by periods of congestion (trading range) where the prices move within a limited range for an extended period. For example: If prices move above the upper band of the trading range, then demand is rising. If prices move below the lower band, then supply is rising.
- Pictorial Price History:
A price chart offers ample of valuable information for every analyst. It is an easy-to-read historical record of a security’s price movement over a period of time. This history chart helps to identify the following things efficiently:
- Reactions prior to and after important events.
- Past and present volatility.
- Historical volume or trading levels.
- Relative strength of a stock versus the overall market.
- Assist with Entry Point:
Technical analysis can help to identify the timing for profitable opportunity to enter point. Usually, analysts use fundamental analysis to decide what to buy and technical analysis to decide when to buy. The timing can play the vital role in trading. Technical analysis can help to identify demand (support) and supply (resistance) levels as well as breakouts. If you simply wait for a breakout above resistance or buy near support levels will improve returns.
The two primary methods that are used to analyse securities and make investment decisions are:
- Technical analysis
- Fundamental analysis
Fundamental analysis and technical analysis plays the most vital role when it comes to approaching the markets, yet they are at opposite ends of the field. They are both are used for researching and predicting future trends in stock prices. Moreover, they also have their advocates and adversaries like any investment strategy or philosophy.
- Fundamental analysis is a technique of assessing securities by attempting to measure the essential value of a stock. Fundamental analysts study the whole thing from the overall economy and industry conditions to the financial condition and management of companies. The important characteristics to fundamental analysts are earnings, expenses, assets and liabilities.
- The crucial point that differentiate the technical analysis from fundamental analysis is that the stock’s price and volume are the only inputs in technical analysis. The main assumption is that all known fundamentals are factored into price. So, there is no need to pay close attention to them. Technical analysts use stock charts to understand patterns and trends that helps in the prediction of market future price movement.
- The most widely used forms of technical analysis are simple moving averages, support and resistance, trend lines and momentum-based indicators.
- The indicators like Simple moving averages helps to evaluate the stock’s trend by averaging the daily price over a fixed time period. The Buy and sell signals are generated when a shorter duration moving average crosses a longer duration one.
- Support and resistance uses price history. Support means the areas where buyers have stepped in before, while resistance consists of the areas where sellers have delayed price advance. Practitioners look to buy at support and sell at resistance.
- Trend lines are comparable to support and resistance, as they also provides a well-defined entry and exit points. Though, they vary in the point where prediction that are made on the basis of historical record of price. They are often applied for stocks moving to new highs or new lows where there is no price history.
There are a various momentum-based indicators such as Bollinger Bands, Chaikin Money Flow, stochastics and moving average convergence divergence (MACD). These each have unique methods and provides buy and sell signals on the basis of different individual principles.


